Heat Maps
Filter by
SubjectRequired *
LanguageRequired *
The language used throughout the course, in both instruction and assessments.
Learning ProductRequired *
LevelRequired *
DurationRequired *
SubtitlesRequired *
EducatorRequired *
Results for "heat maps"
 Status: Free TrialFree TrialÉ
École Polytechnique Fédérale de Lausanne
Skills you'll gain: Scala Programming, Apache Spark, Apache Hadoop, User Interface (UI), Programming Principles, Big Data, Software Design, Data Structures, Software Design Patterns, Functional Design, Data Manipulation, Object Oriented Programming (OOP), Heat Maps, Data Visualization Software, Interactive Data Visualization, Distributed Computing, Computer Programming, Data Processing, Real Time Data, Performance Tuning
4.7·Rating, 4.7 out of 5 stars11K reviewsIntermediate · Specialization · 3 - 6 Months
 Status: Free TrialFree TrialJ
Johns Hopkins University
Skills you'll gain: Ggplot2, Scatter Plots, Plot (Graphics), Data Visualization, Data Visualization Software, Heat Maps, R Programming, Graphical Tools, Data Wrangling, Tidyverse (R Package), Graphics Software
4.9·Rating, 4.9 out of 5 stars129 reviewsIntermediate · Course · 1 - 4 Weeks
 Status: Free TrialFree TrialD
DeepLearning.AI
Skills you'll gain: Generative AI, Tensorflow, Computer Vision, Image Analysis, Generative Model Architectures, Deep Learning, Keras (Neural Network Library), Artificial Neural Networks, Distributed Computing, Unsupervised Learning, Network Model, Performance Tuning, NumPy, Object Oriented Programming (OOP), Heat Maps, Network Architecture
4.8·Rating, 4.8 out of 5 stars1.7K reviewsIntermediate · Specialization · 3 - 6 Months
 Status: PreviewPreviewU
Universidad Austral
Skills you'll gain: Data Visualization Software, Data Visualization, Tableau Software, Interactive Data Visualization, Data Mapping, Spatial Data Analysis, Graphing, Heat Maps, Scatter Plots, Histogram, Time Series Analysis and Forecasting
Beginner · Course · 1 - 4 Weeks
 Status: NewNewStatus: Free TrialFree TrialU
University of Pittsburgh
Skills you'll gain: Data Storytelling, Interactive Data Visualization, Data Visualization Software, Data Presentation, Data Visualization, Tableau Software, Matplotlib, Geospatial Information and Technology, Spatial Analysis, Geospatial Mapping, Visualization (Computer Graphics), Seaborn, Infographics, Heat Maps, Data Ethics, Text Mining, Data Mapping, Network Analysis
Build toward a degree
Intermediate · Course · 1 - 3 Months
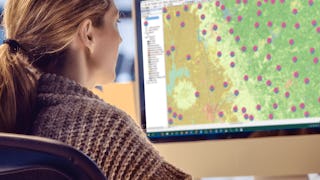 Status: Free TrialFree TrialU
University of California, Davis
Skills you'll gain: ArcGIS, Data Storytelling, Spatial Data Analysis, Data Presentation, Geographic Information Systems, Spatial Analysis, Geospatial Mapping, Heat Maps, Data Visualization Software, Network Analysis, Data Manipulation
4.5·Rating, 4.5 out of 5 stars111 reviewsIntermediate · Course · 1 - 4 Weeks
 Status: Free TrialFree TrialJ
Johns Hopkins University
Skills you'll gain: Data Visualization Software, Interactive Data Visualization, Geospatial Information and Technology, Color Theory, Tree Maps, Data Storytelling, Heat Maps, Data Mapping, Text Mining, Unstructured Data, Network Analysis
Intermediate · Course · 1 - 3 Months
 Status: Free TrialFree TrialU
University of Colorado Boulder
Skills you'll gain: Matplotlib, Plotly, Seaborn, Data Visualization Software, Data Visualization, Statistical Visualization, Interactive Data Visualization, Scatter Plots, Box Plots, Heat Maps, Histogram
Intermediate · Course · 1 - 3 Months
 Status: Free TrialFree TrialD
DeepLearning.AI
Skills you'll gain: Computer Vision, Tensorflow, Image Analysis, Keras (Neural Network Library), Deep Learning, Heat Maps, Network Architecture
4.7·Rating, 4.7 out of 5 stars527 reviewsIntermediate · Course · 1 - 4 Weeks
 Status: PreviewPreviewU
University of Toronto
Skills you'll gain: Scientific Visualization, Data Visualization Software, Statistical Visualization, Interactive Data Visualization, Bioinformatics, Plot (Graphics), Ggplot2, R (Software), Dimensionality Reduction, Scatter Plots, R Programming, Network Analysis, Exploratory Data Analysis, Heat Maps, Molecular Biology, Design Thinking, Statistical Analysis
4.8·Rating, 4.8 out of 5 stars24 reviewsIntermediate · Course · 1 - 3 Months
 Status: Free TrialFree TrialU
University of Minnesota
Skills you'll gain: Health Equity, Health Disparities, Health Systems, Public Health, Social Determinants Of Health, Healthcare Ethics, Health Policy, Data Analysis, Health Care, Data Ethics, Substance Abuse, Correlation Analysis, Heat Maps, Patient Education And Counseling, Community Mental Health Services, Data Visualization, Health Informatics, Trauma Care, Mental Health
5·Rating, 5 out of 5 stars6 reviewsBeginner · Course · 1 - 3 Months
 C
CCoursera Project Network
Skills you'll gain: PyTorch (Machine Learning Library), Heat Maps, Image Analysis, Deep Learning, Artificial Neural Networks, Computer Vision
4.6·Rating, 4.6 out of 5 stars21 reviewsIntermediate · Guided Project · Less Than 2 Hours
Most popular
 Status: Free TrialFree TrialU
University of California, Davis
Specialization
 Status: Free TrialFree TrialU
University of California, Davis
Course
 Status: Free TrialFree TrialT
Tableau Learning Partner
Course
 Status: Free TrialFree TrialU
University of California, Irvine
Specialization
Trending now
 Status: Free TrialFree TrialU
University of California, Davis
Course
 Status: Free TrialFree Trial
Course
 Status: Free TrialFree TrialU
University of California, Davis
Specialization
 Status: Free TrialFree TrialT
Tableau Learning Partner
Course
New releases
 Status: Free TrialFree Trial
Specialization
 Status: Free TrialFree Trial
Course
 Status: Free TrialFree Trial
Course
 Status: Free TrialFree TrialU
University of Pittsburgh
Build toward a degree
Specialization


