Run Chart
Filter by
SubjectRequired
LanguageRequired
The language used throughout the course, in both instruction and assessments.
Learning ProductRequired
LevelRequired
DurationRequired
SubtitlesRequired
EducatorRequired
Results for "run chart"
 Status: NewStatus: Free Trial
Skills you'll gain: Statistical Process Controls, Six Sigma Methodology, Lean Methodologies, Quality Management, Quality Improvement, Kaizen Methodology, Quality Control, Brainstorming, Benchmarking, Process Improvement, Run Chart, Continuous Improvement Process, Pareto Chart, Root Cause Analysis
 Status: NewStatus: Preview
Skills you'll gain: Lean Six Sigma, Quality Management, Process Analysis, Quality Improvement, Process Capability, Data-Driven Decision-Making, Process Flow Diagrams, Pareto Chart, Run Chart, Statistical Process Controls, Process Improvement, Statistical Analysis, Quality Control, Data Analysis, Data Analysis Software, Histogram, Scatter Plots
 Status: Free Trial
Imperial College London
Skills you'll gain: Continuous Quality Improvement (CQI), Run Chart, Qualitative Research, Pareto Chart, Public Health, Patient Safety, Health Policy, Public Health and Disease Prevention, Health Equity, Health Systems, Community Health, Social Determinants Of Health, Clinical Leadership, Patient-centered Care, Care Management, Data Quality, Scientific Methods, Health Care, Health Informatics, Health Disparities
Coursera Project Network
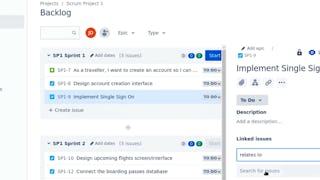
Skills you'll gain: Jira (Software), Sprint Planning, Backlogs, Scrum (Software Development), User Story, Agile Methodology, Agile Project Management, Workflow Management, Run Chart, Project Planning, Project Management, Prioritization, Dependency Analysis
 Status: Free Trial
Imperial College London
Skills you'll gain: Run Chart, Qualitative Research, Pareto Chart, Continuous Quality Improvement (CQI), Care Management, Health Informatics, Quantitative Research, Data Collection, Data-Driven Decision-Making, Statistical Methods, Data Analysis, Systems Of Measurement, Data Management, Time Series Analysis and Forecasting